InsightsCanadian Real Estate at Mid-Year: Searching for a Floor
June 09, 2026 • 5 MIN READ
The Canadian housing market spent the first half of 2026 doing something it had not done in a while: showing faint signs of life. National home sales rose 0.7% in April, the first monthly increase in six months. It is tempting to read that as a turn. It is not, at least not yet. Activity remains roughly 17% below its ten-year average, and the year-to-date sales count through April was the slowest start since 2020. What we are watching is a market trying to find a floor, not one climbing off it.
The national picture: balanced, but barely
April’s modest gain was concentrated in Ontario, with smaller contributions from Prince Edward Island and Alberta. Most other provinces saw sales slip. On the supply side, new listings rose 4.1% and active listings climbed 2.7%, the third increase in four months. The result pushed the national months-of-inventory measure from 5.1 to 5.2, its highest reading since April 2019 once you set the pandemic aside.
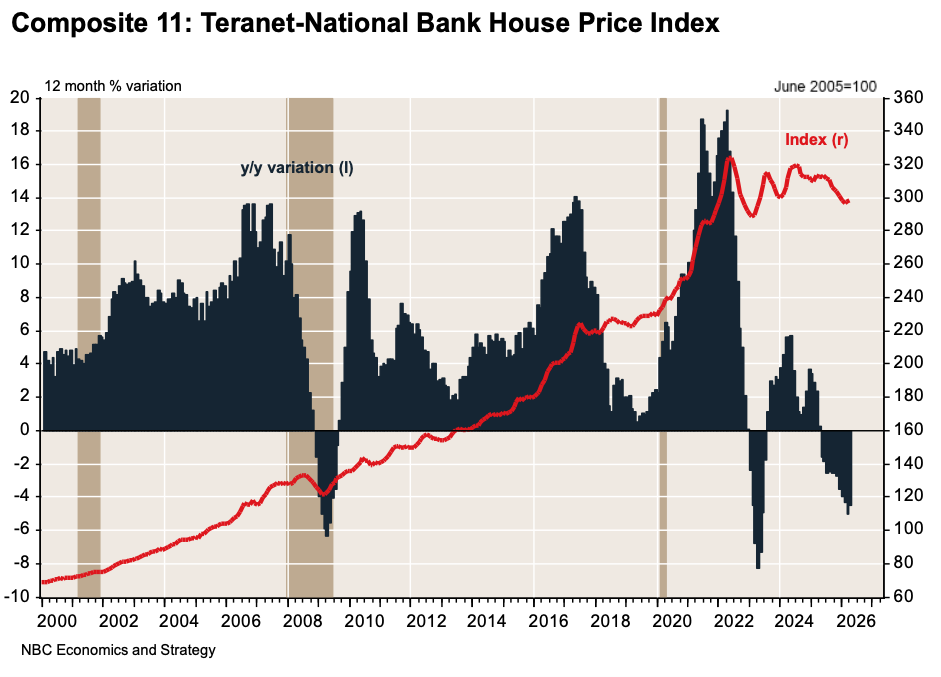
That figure matters because it defines the balance of power. At the national level the market is technically balanced, but the average masks a clear split. Ontario and British Columbia are soft, tilting toward buyers, while every other province still favours sellers. The Teranet-National Bank Composite Price Index reflected the divide, falling 0.7% month-over-month in April. Six of eleven major markets declined, led by Winnipeg at 2.3% and Calgary at 1.2%, with Toronto, Vancouver, Montreal, and Hamilton also lower. Halifax, Ottawa-Gatineau, Victoria, Edmonton, and Quebec City bucked the trend (see the Composite 11 Teranet-National Bank House Price Index chart).
One genuinely strong data point cut against the gloom: housing starts. They jumped to 279.3K on a seasonally adjusted annualized basis, well above the 245K consensus and the highest reading since December 2025. Ontario and British Columbia drove the rebound, with Toronto starts more than doubling on the month. Encouraging on its face, but the context tempers it. With population growth slowing sharply, vacancy rates rising, and unsold inventory accumulating, this looks like the tail end of projects conceived in a very different demographic environment. Expect new construction to slow through the back half of the year and into a notably weak 2027.
Vancouver: stabilizing, not recovering
Closer to home, the story is more pointed. Our preliminary read for May, based on Real Estate Board of Greater Vancouver data, shows seasonally adjusted sales up 0.5% from April, the first monthly increase in three months (see Chart 1, Vancouver home sales and listings).
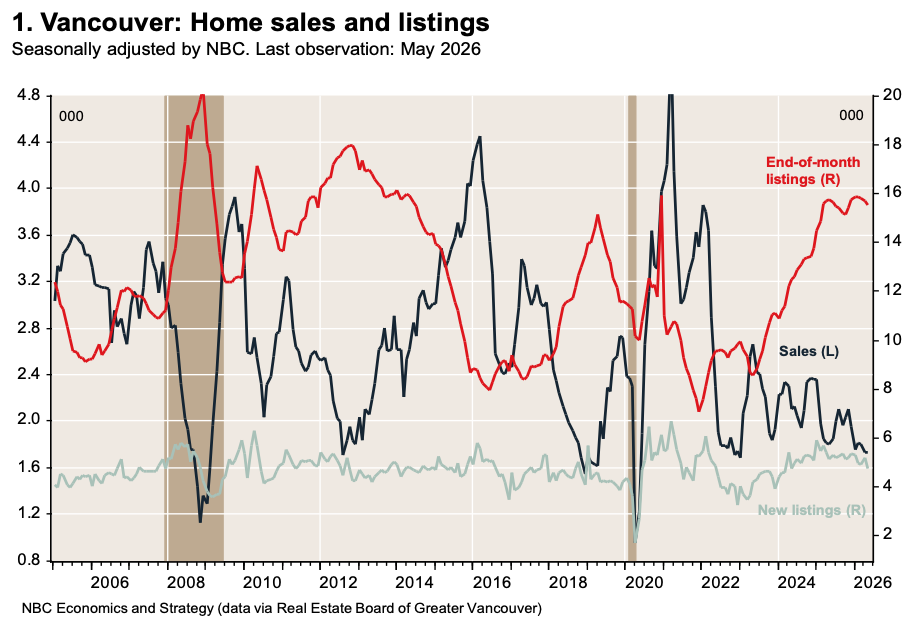
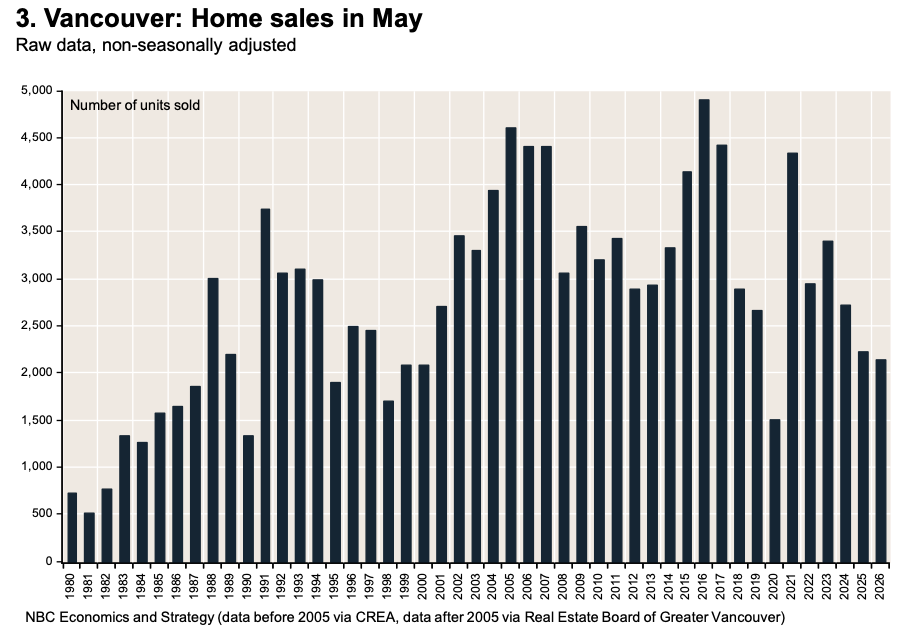
After four declines in five months, even a flat-to-positive print counts as progress. But the level remains 32.7% below the historical average, and the year-over-year comparison was down 3.5%, the eighth consecutive month of annual decline (See chart below).
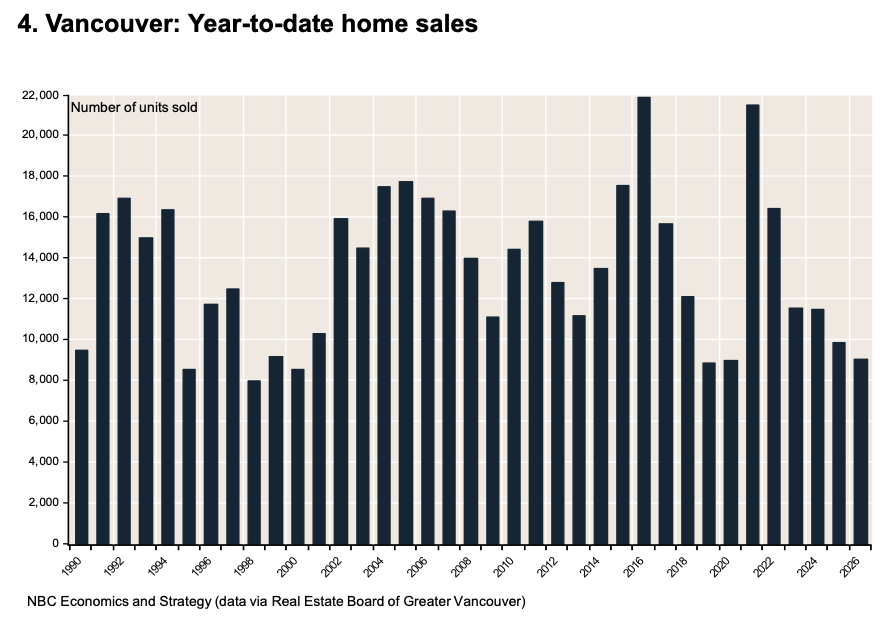
Cumulative sales through May were 8.3% below the same period in 2025 and at their lowest since 2020 (See chart below).
Prices continue to grind lower, though the rate of decline is easing. The MLS Composite Home Price Index fell 6.5% year-over-year in May, a milder contraction than April’s 7.3%. The Teranet measure tells a similar story, with the Vancouver index off roughly 7.4% from a year earlier. Deceleration in the pace of price declines is the kind of second-derivative shift that often precedes a bottom, but it is not a bottom on its own.
The segment data is worth flagging for clients weighing a move. Year-over-year in May, condo sales fell 7.2% and attached homes slipped 1.3%, while detached homes edged up 0.9%. April’s figures showed the same pattern in sharper relief, with detached sales up 14% year-over-year against a 10.7% drop in condos. The detached segment, long the least affordable, is where the relative strength sits. The condo market, weighed down by investor caution and ample supply, remains the soft underbelly.
Supply behaviour has been erratic. New listings dropped 8.6% in May after a 6.3% jump the prior month, and active listings fell 0.8%, the fourth straight monthly decline. Market conditions, measured by the active-listings-to-sales ratio, tightened slightly but stay very loose by historical standards (Chart 2). Sellers, in short, are not flooding the market, which is one reason prices have not fallen further.
Why the market is stuck
The forces holding activity down are not mysterious, and most are not local. Affordability remains the structural constraint in Vancouver. Layered on top is a labour market that has deteriorated quickly. The regional unemployment rate jumped from 5.8% in February to 7.0% in April, its highest level since June 2021, erasing a year of gains in a single quarter. Confidence does not recover while job security is eroding.
Then there is the rate picture. The Bank of Canada’s rate cuts last fall should, in theory, be supporting demand. They are not, because fixed mortgage rates have moved the other way. Renewed inflation expectations, driven in part by conflict in the Middle East, have pushed bond yields and therefore fixed mortgage rates higher over the past two months. Add unresolved trade uncertainty around the USMCA renewal and a shrinking population, and you have a demand backdrop that cuts to the policy rate alone cannot offset.
What it means
For clients, the practical takeaways are straightforward. Buyers with stable income and a long horizon are operating in the most favourable Vancouver conditions in years, with loose inventory, motivated sellers, and prices well off peak. The detached segment in particular rewards patience and pre-arranged financing. Sellers should expect longer timelines and price to the market rather than to memory of 2022. And anyone treating real estate as a near-term tactical allocation should recognize that the catalysts for a genuine recovery, namely a healthier labour market and lower fixed mortgage rates, are not yet in place.
A floor is forming. Calling the exact moment it sets is less useful than positioning for it. We would rather act on improving fundamentals than on a single month’s bounce, and the fundamentals are not there yet.
Sources Used: National Bank of Canada, Housing Market Monitor (May 19, 2026); National Bank of Canada, Economic News: Vancouver Home Sales Stabilized in May (June 2, 2026). Chart references correspond to the June 2 release.