
InsightsShould You Invest at All-Time Highs?
July 08, 2026 • 4 MIN READ
The S&P 500 has spent much of the past year setting records, and if you’re holding cash right now, every new high probably feels like one more reason to wait. Paying a price nobody has ever paid before seems like the definition of buying at the top.
History says otherwise. All-time highs are not a warning sign. They are what a functioning equity market looks like most of the time, and the data on investing at them is unambiguous.
New highs are normal, not rare
Since 1950, the S&P 500 has set more than 1,325 all-time highs, an average of over 17 per year. Roughly 7% of all trading days close at a record. If your plan is to avoid investing whenever the market is at or near a peak, you’re planning to avoid the market itself.
More importantly, highs cluster. According to J.P. Morgan’s Guide to the Markets, 81% of all-time highs since 1950 were followed by another all-time high within one week. Strength begets strength. The record that feels like a ceiling today is, more often than not, a step on the way to the next one.
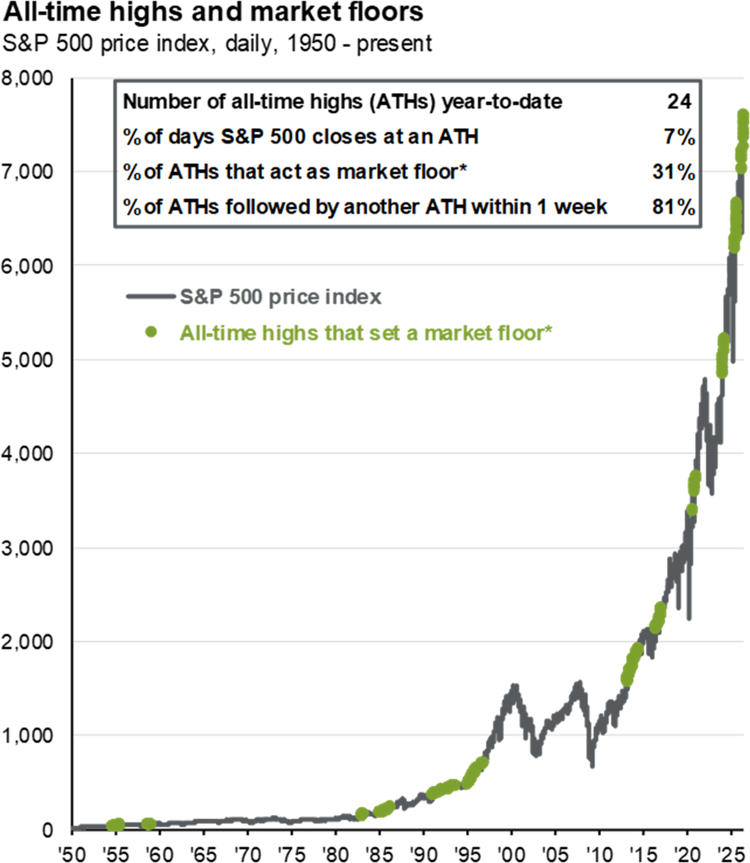
Source: J.P. Morgan Asset Management, Guide to the Markets. Green dots mark all-time highs from which the market never fell more than 5%.
Nearly a third of all-time highs became floors, not ceilings
Here’s the statistic that should reframe how you think about record levels: 31% of all-time highs since 1950 acted as a market floor, meaning the index never traded more than 5% below that level again. An investor waiting on the sidelines at those moments never got a better entry point. Not in a correction, not in a crash. Never.
The instinct to wait rests on an assumption that a meaningfully lower price is coming. Roughly one time in three, it wasn’t.
What returns look like when you buy at the top
J.P. Morgan compared cumulative S&P 500 total returns from investing on any random day versus investing only at a new all-time high, from 1988 through 2025. Buying at a record high produced an average five-year cumulative return of 82%, versus 76% for investing on any day. At three years: 46% versus 41%. At one year: 14% versus 12%.
Read that again. The “worst possible” entry point has historically outperformed the average one over most horizons.
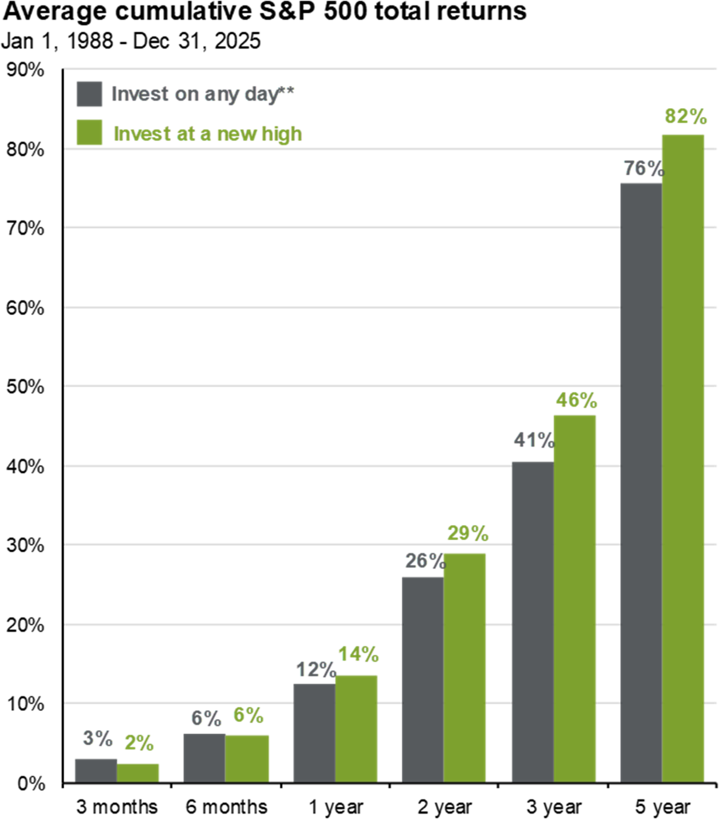
Source: J.P. Morgan Asset Management, Guide to the Markets, Jan 1, 1988 to Dec 31, 2025.
How often does a crash actually follow a record?
RBC Global Asset Management looked at every all-time high since 1950 and asked how often a correction of more than 10% followed. One year out, it happened just 9% of the time. And over any five-year period following an all-time high, the S&P 500 has never finished down more than 10%. That span includes Black Monday, the dot-com bust, and the 2008 financial crisis.
The feared scenario, investing at the peak and watching a crash erase your capital, is not just unlikely over a reasonable horizon. On a five-year view, it has literally never happened.
The real risk is the waiting
None of this means markets can’t fall from here. They can, and at some point they will. But the decision to hold cash until a correction arrives has two problems: the correction often doesn’t come from the level you’re waiting at, and even when it does, most investors who waited for it don’t buy, because the same environment that produces a 15% drawdown produces headlines that make investing feel even worse than record highs did.
If a lump sum at today’s levels feels uncomfortable regardless of the data, the answer isn’t the sidelines. It’s structure: a defined dollar-cost averaging schedule over a set number of months converts a paralyzing decision into an automatic one, and gets your capital working on a timeline instead of a feeling.
The market being at an all-time high is not a reason to wait. It’s what the market does.
If you’re sitting on cash from a business sale, portfolio restructuring, or an inheritance and the entry point is the sticking point, that’s a conversation worth having with numbers on the table. [Contact link]
Sources Used
- J.P. Morgan Asset Management, Guide to the Markets, “Investing at all-time highs” chart (S&P 500 price index 1950 to present; average cumulative total returns Jan 1, 1988 to Dec 31, 2025). am.jpmorgan.com/guide-to-the-markets
- RBC Global Asset Management, “Investing at all-time highs” (data Jan 1, 1950 to Aug 2025). rbcgam.com: Investing at all-time highs