
InsightsMonthly Market Wrap – October 2026
November 06, 2026 • 10 MIN READ
Key Takeaways
ROTATION, NOT RETREAT
Equity leadership changed hands in October as renewed questions about the financial viability of artificial intelligence spending weighed on the year’s winners. The S&P/TSX added 1.1% while the Russell 1000 Growth slipped 6.1% and emerging markets declined 8.0%.
EARNINGS STRENGTH RUNS DEEPER THAN AI
S&P 500 profits are growing at one of the strongest annual rates on record, and while more than half of that growth is tied to the AI complex, a clear majority of sectors are expanding earnings above their five-year averages.
THE LOONIE FIRMS, THE GREENBACK GRINDS HIGHER
The Canadian dollar appreciated 1.7% against a broadly stronger U.S. dollar as markets priced a more hawkish Bank of Canada, though the currency remains down 1.7% year to date.
MARKETS DIGEST A POLITICAL SHIFT
The U.S. midterms have since delivered Democratic control of both the House and Senate, and markets have experienced heightened volatility as investors reassess the fiscal, tax, and trade policy outlook under a newly divided government.
BONDS REBOUND AS CENTRAL BANKS TIGHTEN
The Canadian bond universe gained 1.5% on a flight to quality, even as the Bank of Canada delivered its first rate hike since 2023 and the Federal Reserve signalled further tightening ahead.
TWO ECONOMIES, TWO INFLATION STORIES
The U.S. economy grew 3.4% annualized in the third quarter with inflation stuck near 3%, while Canadian core inflation returned to the 2% target for the first time since early 2021 against a slack labour market.
Introduction
October saw market forces move back into better balance. Renewed doubts about the financial sustainability of the artificial intelligence buildout prompted a rotation out of the year’s leaders, including emerging markets and the Nasdaq 100, and into laggards such as Canadian equities and bonds. Sovereign debt enjoyed its best month since the Middle East conflict began as investors sought quality, while oil extended its advance and gold consolidated after a powerful run. The hesitation is fairly typical of the weeks preceding U.S. midterm elections, and history suggests the months that follow tend to reward patience.
Equity Markets
Performance as of September 30th, 2026
| Index | September 2026 | 3-Month | Year-to-Date |
| S&P/TSX Composite (C$) | 1.1% | 1.1% | 12.3% |
| S&P 500 (US$) | -0.9% | 1.2% | 10.7% |
| Russell 1000 Growth (US$) | -6.1% | -0.6% | -0.6% |
| Russell 2000 (US$) | 0.5% | -4.1% | 13.3% |
| MSCI EAFE (US$) | -0.8% | -2.4% | 7.2% |
| FTSE Canada Universe Bond (C$) | 1.5% | 0.0% | 0.7% |
| Gold (US$) | -6.3% | -2.9% | -9.5% |
| CAD/USD | 1.7% | 0.5% | -1.7% |
Total returns as of October 31, 2026. Source: Morningstar Direct.
U.S. equities edged lower in October, with the S&P 500 easing 0.9% to leave its year-to-date advance at 10.7%. The modest headline concealed a sharp rotation: Communication Services fell 15.1% as Alphabet and Meta recorded heavy losses after disappointing results, Information Technology declined 6.8%, while Energy surged 14.0% and defensives rallied, led by Consumer Staples at 11.6%, Utilities at 10.2%, and Health Care at 9.9%. Growth benchmarks bore the brunt, with the Russell 1000 Growth index down 6.1%, while value and equal-weight measures meaningfully outpaced the capitalization-weighted index and the Russell 2000 added 0.5% to remain up 13.3% on the year.
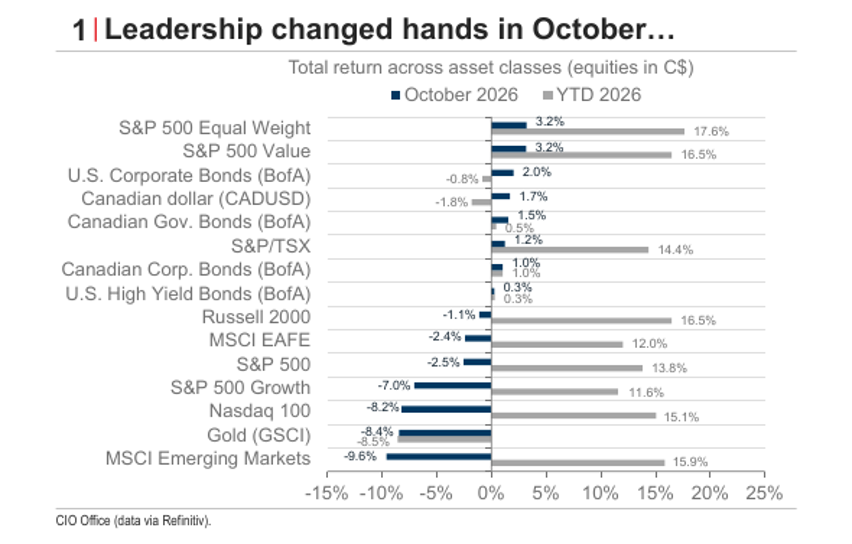
Chart 1 – Source: NBC CIO Office (data via Refinitiv).
Canadian equities were a principal beneficiary of the rotation. The S&P/TSX Composite advanced 1.1% in October, bringing its year-to-date return to 12.3%, supported by its smaller technology exposure and larger energy weight. Energy led with an 8.7% gain and is now up 38.8% this year, while Consumer Staples added 6.4%, Consumer Discretionary 5.9%, and Financials 3.6%. The notable exception was Materials, down 13.1% as the pullback in gold weighed on precious-metals producers.
International results followed the same fault line. The MSCI EAFE index slipped 0.8% in U.S. dollar terms and remains up 7.2% year to date, cushioned by its limited exposure to the AI theme. Emerging markets bore the brunt of the reversal, declining 8.0% on the month as South Korea and Taiwan, home to much of the global semiconductor supply chain, led the retreat; even so, the region retains a 13.8% gain for the year.
The earnings backdrop remains the market’s foundation. S&P 500 companies continue to post one of the strongest annual growth rates on record, and while more than half of that growth is attributable to companies tied to AI, the strength is not narrowly confined: roughly nine in ten global sectors are reporting positive year-over-year earnings growth, and about eight in ten are growing above their five-year average. Notably, AI-related stocks now trade at 16.1 times forward earnings, below the S&P 500 at 18.5 times and the index excluding AI at 19.9 times, the first such discount on record. The message for portfolios is selectivity rather than abstinence.
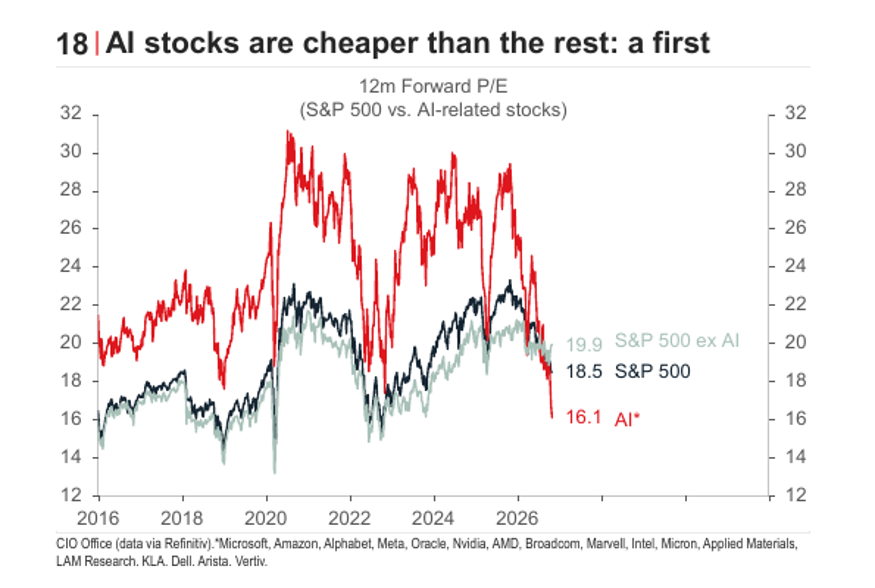
Chart 2 – Source: NBC CIO Office (data via Refinitiv).
Fixed Income and Credit
Canadian fixed income rebounded sharply from a difficult September, with the bond universe returning 1.5% in October as yields declined broadly and long-term bonds gained 2.9%. The rally reflected a flight to quality as AI-related jitters tested risk appetite. The recovery came even as policy tightened: the Bank of Canada raised its overnight rate by 25 basis points to 2.50% on October 28, its first increase since 2023, following the Federal Reserve’s September hike that brought the fed funds target to 4.00%.
Markets are now pricing roughly three additional hikes from each central bank over the next twelve months, with the federal funds rate expected to reach 4.50% by March and the Bank of Canada’s overnight rate 3.25% in 2027. Some humility is warranted: twelve-month market expectations for policy rates have missed by roughly 90 basis points on average over the past five years. Ten-year yields sit near 4.84% in the United States and 3.67% in Canada, and further volatility should be expected as markets gauge the pace and destination of this tightening cycle.
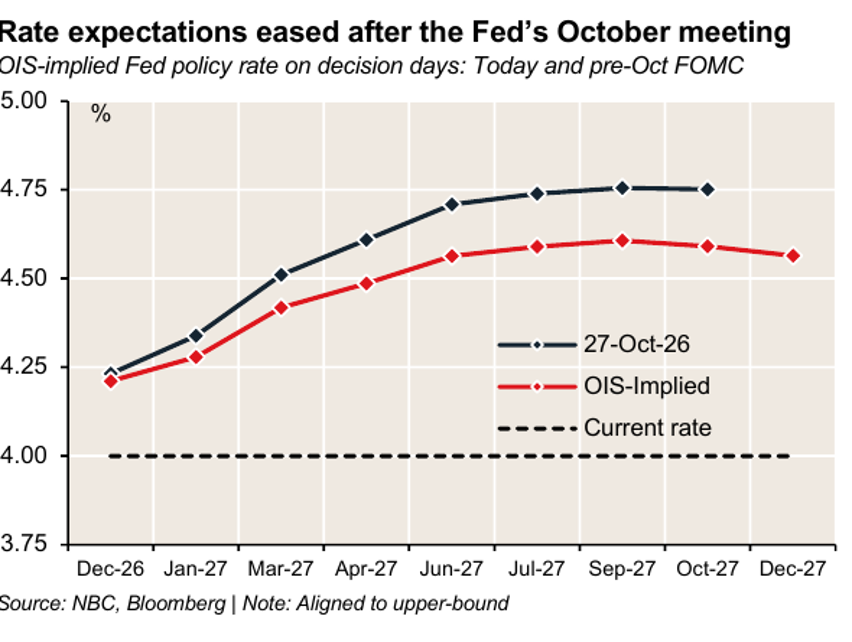
Chart 3 – Source: NBC Economics and Strategy (data via Bloomberg).
Credit markets participated in the rally, though with less enthusiasm at the riskier end. Canadian corporate bonds returned 1.0% in October, U.S. investment-grade corporates gained 2.0%, and U.S. high yield added a more modest 0.3%, lagging on its shorter duration and softer risk tone. Corporate balance sheets remain broadly healthy, but with spreads offering limited compensation for risk late in the cycle, an emphasis on quality issuers and security selectivity continues to serve portfolios well.
Commodities and Currencies
Energy once again dominated the commodity complex. WTI crude advanced 17.3% in October and is now up 87.8% year to date near US$108 per barrel, as shipping through the Strait of Hormuz remains disrupted and global refining capacity has been impaired. For Canadian producers the benefit is incomplete, as the discount on Western Canadian Select has widened beyond US$25 per barrel. Gold declined 6.3% and is down 9.5% this year following its spring correction. Copper eased 0.9% but remains up 15.1% year to date, supported by data-centre construction and electrification demand tied to artificial intelligence.
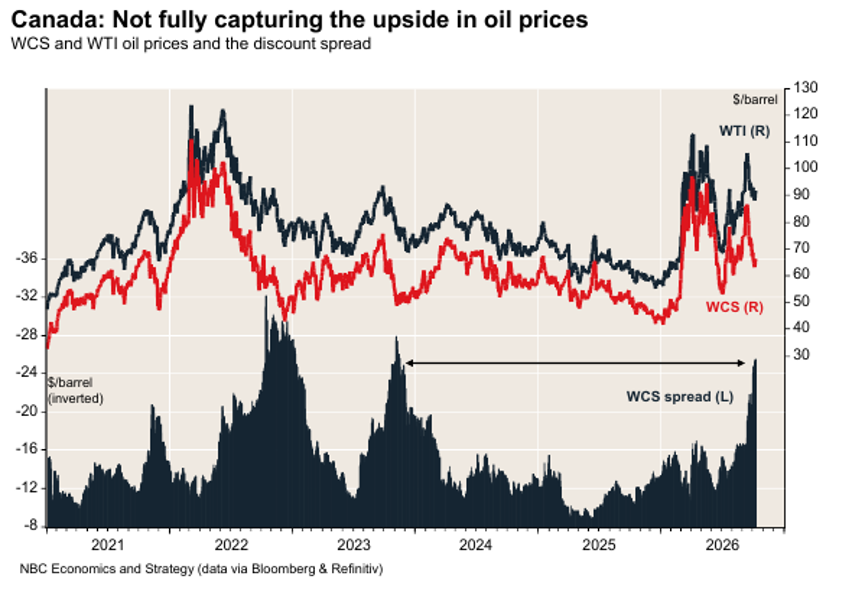
Chart 4 – Source: NBC Economics and Strategy (data via Bloomberg & Refinitiv).
In currency markets, the U.S. dollar extended its rally, with the trade-weighted index adding 0.4% in October for a 3.6% year-to-date gain, supported by the Federal Reserve’s return to tightening, elevated yields, and safe-haven demand. The Canadian dollar was a rare outperformer, appreciating 1.7% as markets priced a more hawkish Bank of Canada, though it remains down 1.7% this year with USD/CAD near 1.41, and a move toward 1.43 by year-end remains plausible before a gradual recovery through 2027. For Canadian investors, these swings meaningfully influence realized returns on unhedged foreign holdings, a reminder that deliberate currency management adds value across cycles.
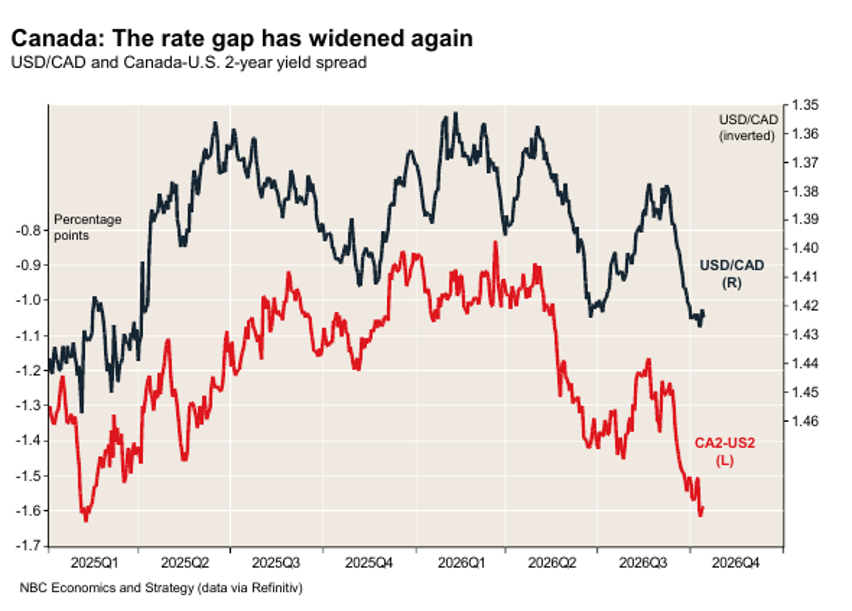
Chart 5 – Source: NBC Economics and Strategy (data via Refinitiv).
Economic Overview
United States
The American economy accelerated into the fall. Real GDP grew 3.4% annualized in the third quarter, the fastest pace in a year, powered by the strongest business investment since late 2020: spending on information-processing equipment rose 37.4% annualized and software 9.6%, while data-centre construction continues to boom. Services consumption posted its strongest increase in more than four years at 4.1% annualized, even as spending growth outruns disposable income and the savings rate declines.
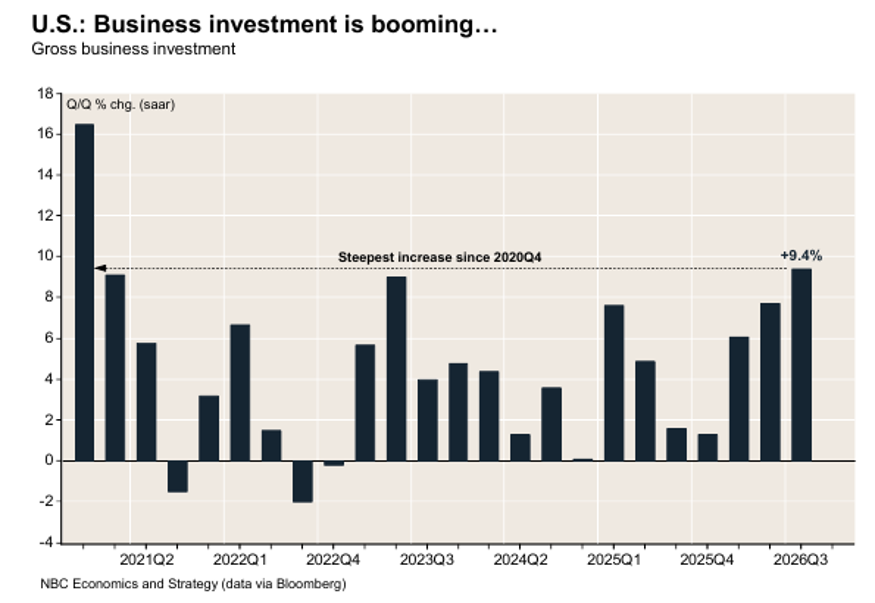
Chart 6 – Source: NBC Economics and Strategy (data via Bloomberg).
The flip side of this vigour, combined with persistent energy disruptions, is inflation that refuses to slow: price growth has been stuck near 3% for two years and core momentum has re-accelerated. The labour market offers only partial comfort, with initial jobless claims at their lowest since 1969 yet real hourly earnings down 0.7% over the past year, helping explain why consumer sentiment, at 46.3, sits near record lows. Against this backdrop the Federal Reserve is expected to raise rates further to 4.50% by March, and growth is forecast at 2.4% in both 2026 and 2027 before easing to 2.0% in 2028.
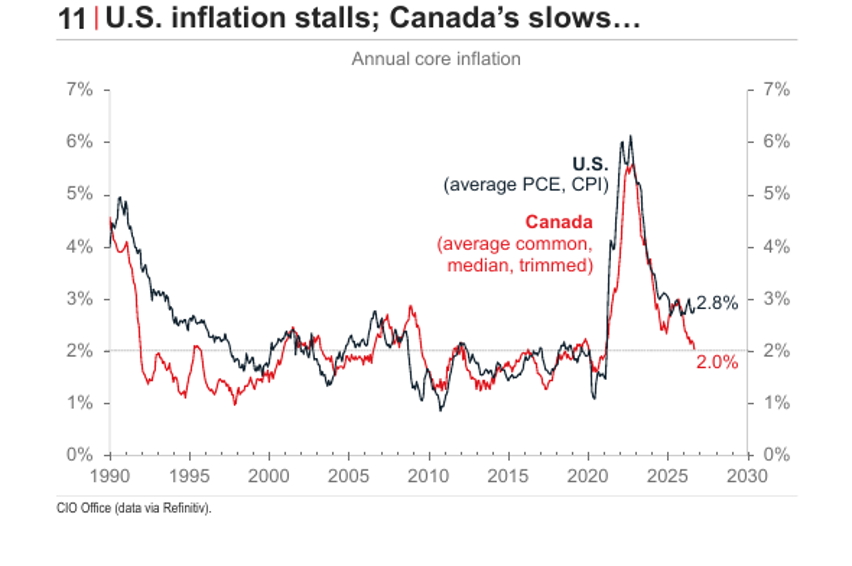
Chart 7 – Source: NBC CIO Office (data via Refinitiv).
The midterm elections have delivered Democratic control of both chambers of Congress, and markets have traded with heightened volatility as investors reassess the fiscal, tax, and trade policy outlook under divided government. History offers a reassuring precedent, however: in every U.S. midterm cycle since 1950, the S&P 500 has been higher twelve months after the vote, an unbroken record spanning more than seven decades, and performance in the year following midterms has on average exceeded that of other years.
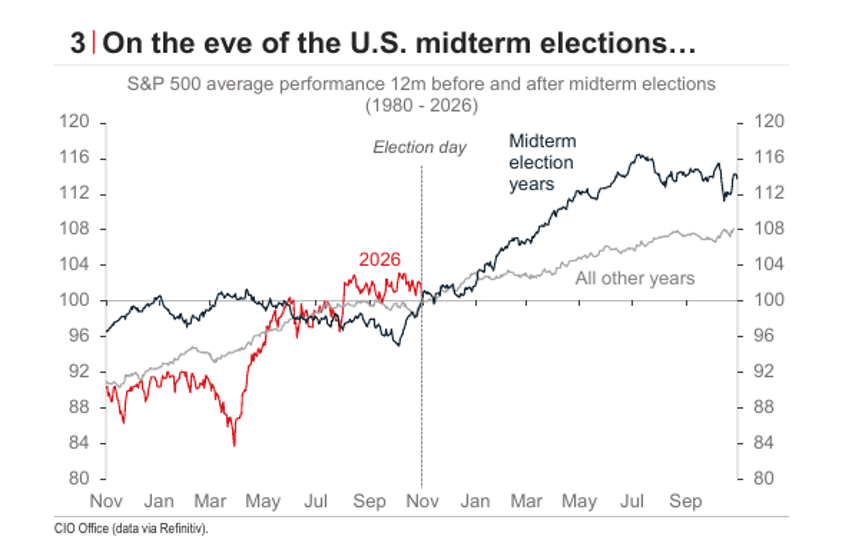
Chart 8 – Source: NBC CIO Office (data via Refinitiv).
Canada
Canada’s picture is nearly the mirror image: a softer economy with better-behaved inflation. Employment fell by roughly 68,000 in September, but the weakness was concentrated almost entirely in the public sector, while private-sector employment continued to rise modestly. The labour market has been in excess supply for 28 consecutive months, helping bring wage growth down toward 2.6% and returning the average of core inflation measures to the 2% target for the first time since early 2021.
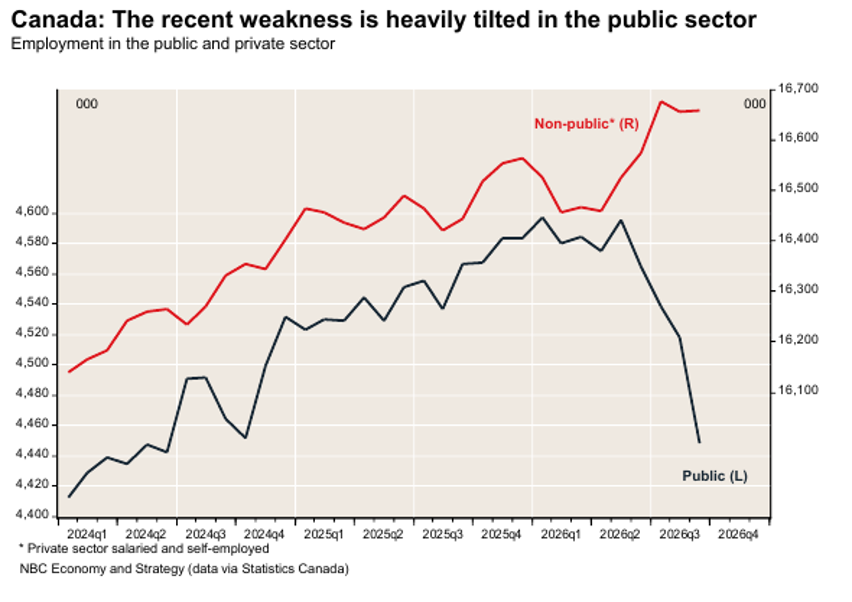
Chart 9 – Source: NBC Economics and Strategy (data via Statistics Canada).
The Bank of Canada nonetheless raised its policy rate in October, concerned that energy costs, a weaker currency, and tariff pass-through could lift inflation, and it revised its 2027 inflation forecast up to 3.1%. Growth is expected to slow to 1.0% this year before recovering to 1.6% in 2027. Encouragingly, the policy backdrop is turning more supportive: permanent immediate expensing now covers 65% of business investment, leaving Canada’s marginal effective tax rate on new investment at less than half the U.S. level, and net foreign direct investment has returned to balance after a decade of outflows. The baseline nevertheless assumes trade tensions with the United States, which still absorbs roughly 70% of exports, persist near term, a reminder that an easing of tariff frictions remains the most powerful potential catalyst for the Canadian economy.
Bottom Line
October’s defining feature was rotation, and it was a healthy one. Capital moved from the year’s most crowded trades toward bonds, Canadian equities, and defensive sectors, and diversified portfolios were rewarded precisely when the dominant theme wobbled. The earnings foundation beneath markets remains broad, and the repricing of AI-related shares to a discount suggests a market that is discriminating rather than euphoric.
The watch list remains substantial. The sustainability of debt-financed AI capital spending, energy prices while the Strait of Hormuz remains disrupted, sticky U.S. inflation, and central banks tightening on both sides of the border all argue against complacency. Elevated expectations leave little room for disappointment where optimism is greatest.
In this environment, we remain focused on maintaining diversification across asset classes, regions, and currencies, emphasizing quality investments with durable earnings and strong balance sheets, and preserving flexibility within portfolios. Periods of leadership change are a normal feature of healthy markets, and we are prepared to treat further weakness as an opportunity rather than a threat, while keeping a disciplined eye on the developments that would change our assessment.
Sources Used
• MMW Pref Table – Oct 31st, 2026 (Morningstar Direct, supplied Nov 6)
• Asset Allocation Strategy, CIO Office, November 2026 (“Turning the page”)
• Monthly Fixed Income Monitor, NBC Economics and Strategy, November 2026
• Forex, NBC Economics and Strategy, October 2026
• Monthly Economic Monitor – U.S., NBC Economics and Strategy, November 2026
• Monthly Economic Monitor – Canada, NBC Economics and Strategy, October 2026
• Monthly Economic Monitor – World, NBC Economics and Strategy, October 2026
• Monthly Equity Monitor, NBC Economics and Strategy, September 2026