InsightsThe New Borrower at the Long End: Why Big Tech’s Bond Sales Are Pushing Rates Higher
October 22, 2026 • 14 MIN READ
The short version
- Long-term interest rates jumped in September. The 10-year U.S. Treasury yield crossed 5% for the first time since 2007, and the 30-year passed 5.6%, a level last seen in 2002.
- The usual suspects (a Fed rate hike, stubborn inflation, oil, government debt) explain part of it. A newer force explains the rest: the five biggest technology companies have spent so much on AI data centres that their free cash flow has turned negative, so they are borrowing hundreds of billions of dollars in the bond market, for 30 years and more.
- That puts them in direct competition with the U.S. government for the same bond buyers. More borrowers chasing the same pool of money means a higher price for money, which is what a higher yield is.
- The practical consequence: long-term rates and short-term rates are now being driven by different forces. The long end of the bond market has a new, large borrower whose needs do not depend on what the Fed does next.
What happened in September
September was the roughest month for long-term bonds in years. The 10-year Treasury yield started the month near 4.7% and finished above 5.25%. The 30-year climbed above 5.6% and reached 5.66% in early October. On a single day, September 23, the 10-year yield rose 13 basis points, its biggest one-day jump since the tariff shock of April 2025.
A quick translator. A basis point (bp) is one hundredth of a percent, so 100 bps = 1%. A bond’s yield is the annual return you lock in by buying it today. When yields rise, existing bond prices fall.
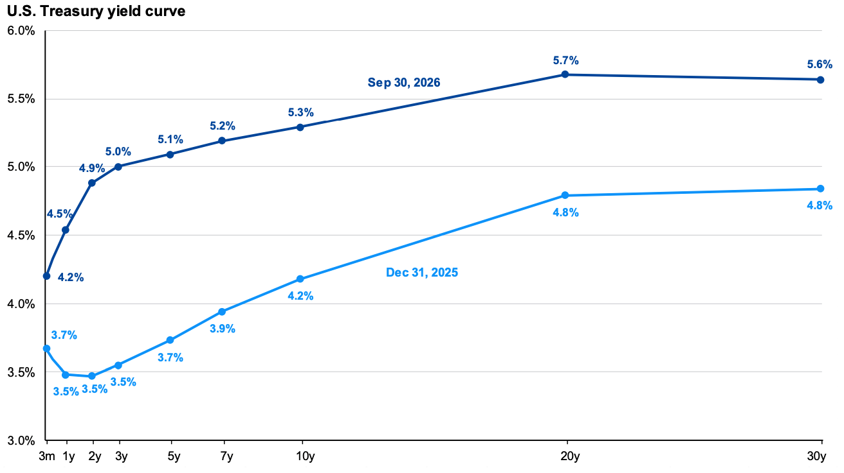
Chart 1: The U.S. Treasury yield curve at September 30, 2026 versus December 31, 2025. Source: J.P. Morgan Asset Management, U.S. Treasury.
Two things in Chart 1 matter. First, the entire curve has shifted up since the start of the year: the 2-year is up about 1.4 percentage points, the 10-year about 1.1 and the 30-year about 0.8. In September alone, every maturity from 3 months to 30 years rose by roughly 30 to 45 bps, a repricing of the whole level of interest rates rather than a bet on the next Fed meeting. Second, the 20- and 30-year yields sit about 40 bps above the 10-year even though the Fed is tightening. When the long end of the curve stays this steep while the central bank is raising rates, the market is telling you something about supply and demand for long-term bonds.
The usual explanations
They are all real. The Fed raised rates by 25 bps in mid-September to a range of 3.75% to 4%, its first increase since 2023, and signalled another before year end. Oil has stayed high on Middle East supply risk. Inflation has not come down as hoped. U.S. national debt crossed $40 trillion in August, prompting the Treasury to double its bond buyback programme. And on October 2, yields rose even after a weak jobs report, which is not how a market driven purely by the economy behaves.
None of these fully explains why 30-year bonds have sold off harder than 2-year bonds. For that, you need to look at who else is borrowing.
The explanation you haven’t heard: Big Tech has become a giant bond issuer
A “hyperscaler” is simply a company that runs enormous data centres: Alphabet (Google), Amazon, Meta, Microsoft and Oracle. These five are in an arms race to build the computing power behind artificial intelligence, and the bill has become too large to pay out of cash.
From 2020 to 2024, the five averaged about $28 billion a year in bond sales. In 2025 they sold $108 billion. By early July 2026 they had already sold $194 billion, roughly 9% of all high-quality corporate bonds issued worldwide this year. By late August the figure was about $223 billion, more than double all of last year, with four months still to go.
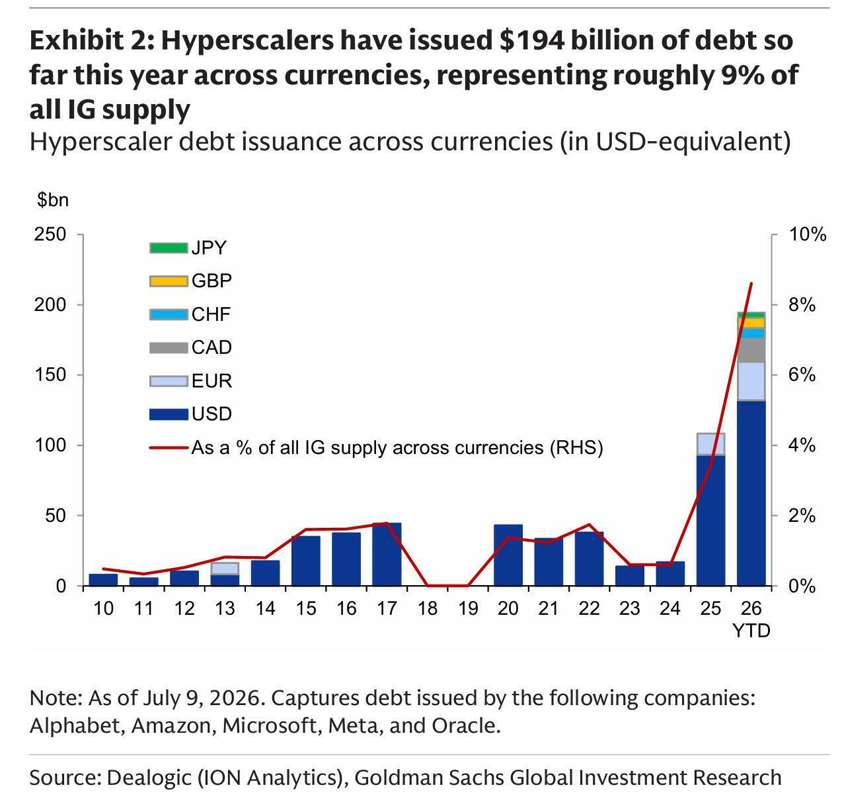
Chart 2: Hyperscaler bond issuance by year and currency. Source: Dealogic, Goldman Sachs Global Investment Research, as of July 9, 2026.
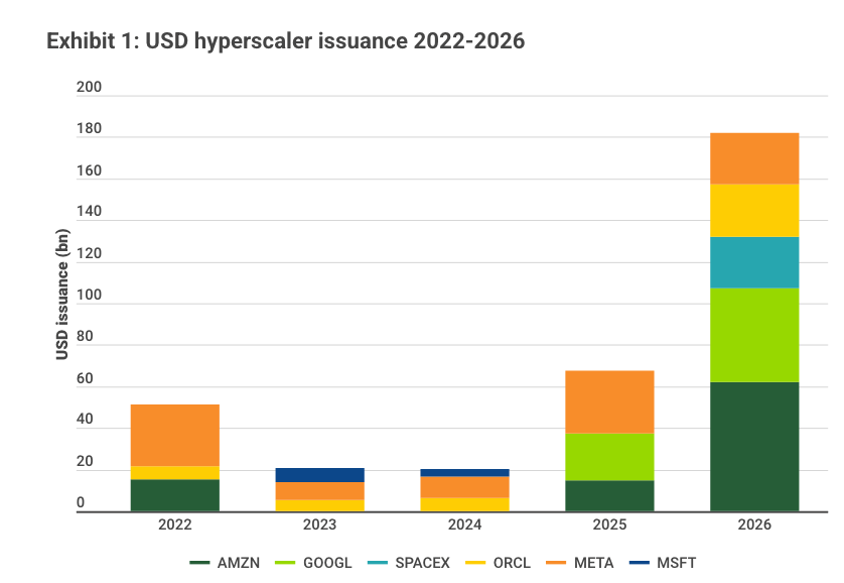
Chart 3: U.S. dollar bond issuance by company, 2022 to 2026 year to date. Amazon, Alphabet, Meta and Oracle account for nearly all of the 2026 surge; Microsoft has not yet come to market. Source: TwentyFour Asset Management, Bloomberg.
One comparison puts the scale in perspective. Capital Group calculates that through August 31, the five hyperscalers plus SpaceX and Nvidia had issued $290.7 billion of bonds across currencies. The U.S. Treasury issued $321 billion of 10-year notes over the same period. A handful of technology companies are now borrowing almost as much long-term money as the U.S. government does at its benchmark maturity.
The forecasts all point the same way. UBS expects $270 to $290 billion this year. Goldman Sachs expects $420 billion in 2027, a 60% increase. Oracle alone sold $54 billion of bonds in a single deal in March.
Why they cannot stop borrowing
The simplest explanation for the bond issuance is that free cash flow has gone negative. Free cash flow is the cash a business has left after paying for its operations and its capital projects. For fifteen years these companies generated more of it than any firms in history, and spent only about 40% of their operating cash on capital projects. In 2026, capital spending is consuming close to 100% of operating cash flow. When you spend every dollar you make on construction, there is nothing left over, and anything beyond that has to be borrowed.
The tipping point arrived this year. Alphabet reported negative free cash flow of $5.9 billion in the second quarter, its first negative quarter since going public in 2004, after capital spending in the first half of the year more than doubled to $98 billion. Amazon has also slipped into negative territory, with analysts projecting a deficit of $17 to $28 billion for the full year. Microsoft is now the only one of the big U.S. hyperscalers still generating positive free cash flow. S&P Global Ratings expects all six of the largest hyperscalers to burn cash in both 2026 and 2027, with no recovery until 2029.
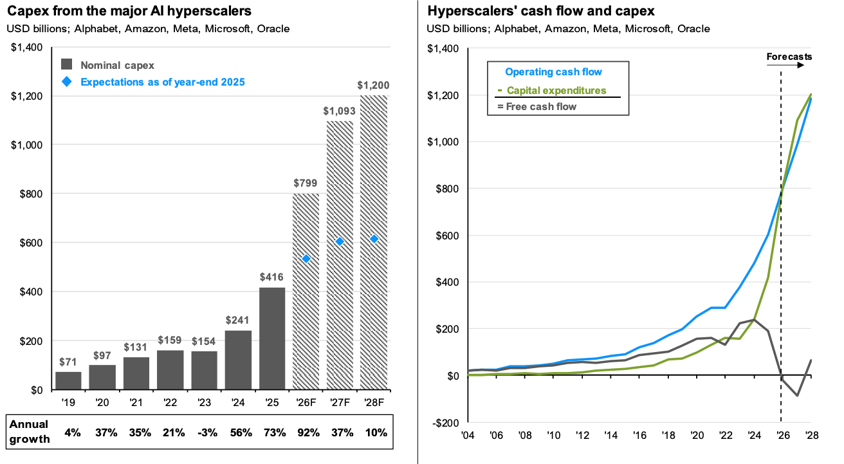
Chart 4: Left: annual capital spending by the five hyperscalers, 2019 to 2028 forecast. Right: operating cash flow, capital spending and the free cash flow left over. Source: J.P. Morgan Asset Management.
Chart 4 is the whole story in one picture. On the right, the green capital-spending line crosses above the blue operating cash flow line in 2026 and free cash flow (the grey line) drops below zero for the first time in the group’s history. On the left, capital spending nearly doubles this year to about $800 billion and keeps climbing toward $1.2 trillion by 2028. Bank of America puts the combined shortfall at roughly $64 billion this year, $144 billion in 2027 and $186 billion in 2028. Every dollar of that shortfall has to come from somewhere, and the bond market is where they have gone to find it.
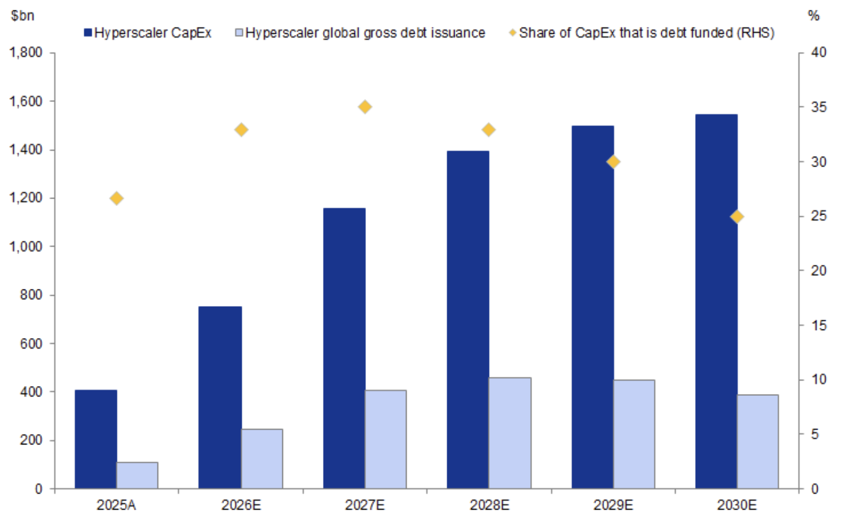
Chart 5: Hyperscaler capital spending, gross bond issuance and the share of spending funded with debt, 2025 to 2030. Source: Goldman Sachs Global Investment Research.
Goldman’s own forecast, in Chart 5, has the share paid for with borrowed money rising from about a quarter in 2025 to 35% in 2027, with annual bond issuance holding at $400 billion or more every year through 2030. And because data centres take time to earn their keep (the revenue arrives anywhere from three months to two years after the money is spent), the borrowing continues well past the peak of construction. Goldman estimates the group may need another $1.3 trillion of financing between 2028 and 2030.
Why this pushes up long-term rates
The volume alone would be remarkable. What makes it a story about your bond portfolio is how long these companies are borrowing for.
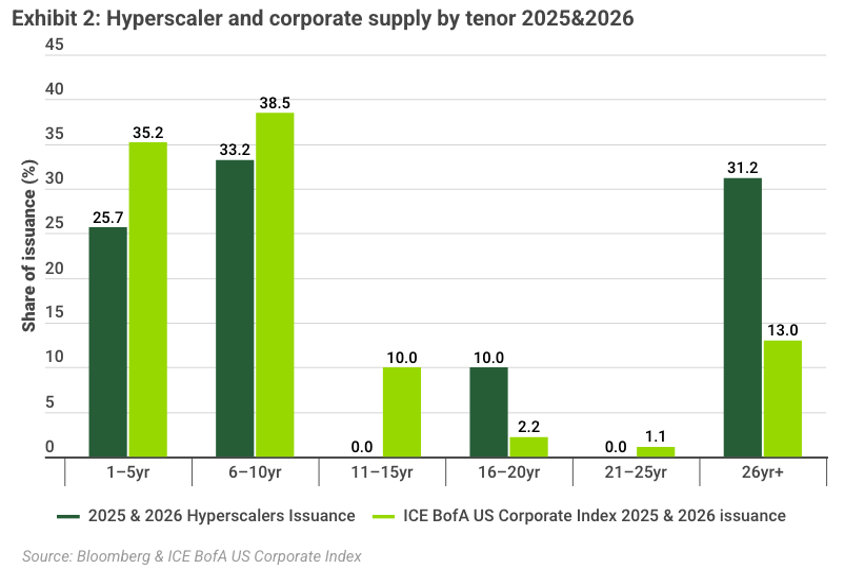
Chart 6: Share of 2025 and 2026 bond issuance by maturity bucket, hyperscalers versus the ICE BofA US Corporate Index. Source: TwentyFour Asset Management, Bloomberg, ICE BofA.
Chart 6 shows where the money is being raised. Over 2025 and 2026, 41% of hyperscaler bonds mature in more than 15 years, versus 16% for the typical corporate borrower, and 31% mature in 26 years or more, against 13% for the index. Almost nothing sits in the 11-to-25-year range; the hyperscalers are going straight to the longest end of the curve. Amazon has sold bonds that mature in 2076. Alphabet sold a 100-year bond maturing in 2126, the first century bond from a technology company since Motorola in 1997. Meta and Oracle have paper out to 2066. Microsoft, the one holdout, has not yet borrowed to cover its 2026 and 2027 spending, so more long-dated supply is coming.
Here is the mechanism in plain terms. There is a limited group of investors who buy 30-year bonds: life insurers, pension funds and large institutions matching very long-term liabilities. For decades, the main thing competing for their money at that maturity was the U.S. Treasury. Now a 30-year bond from Alphabet or Amazon, rated AA or better and paying 5.5% to 6%, is a near-perfect substitute. Apollo’s chief economist Torsten Sløk put the question directly: who is the marginal buyer of all this new paper, and will that money come out of Treasury purchases, pushing rates up? The answer the market gave in September was yes.
The bigger picture: more demand for money means a higher price for money
There is a deeper point beyond bond supply. For most of the 2010s the world had more savings than good projects to invest in. That is the main reason interest rates spent a decade near zero: too much money chasing too little real investment.
The AI buildout reverses that. When a handful of companies decide to spend $1 trillion a year on physical infrastructure, they are bidding for real resources: land, electricity, equipment, workers and, above all, savings. The price that clears that competition is the interest rate. This is not something the Fed controls. The Fed sets the overnight rate; it does not set the return savers demand to lend for 30 years into an economy that suddenly wants a lot more capital. If the investment boom is real, higher long-term rates are simply what it costs.
Investors are already noticing
Bond buyers are demanding more to absorb all this new debt, and you can see it in the pricing.
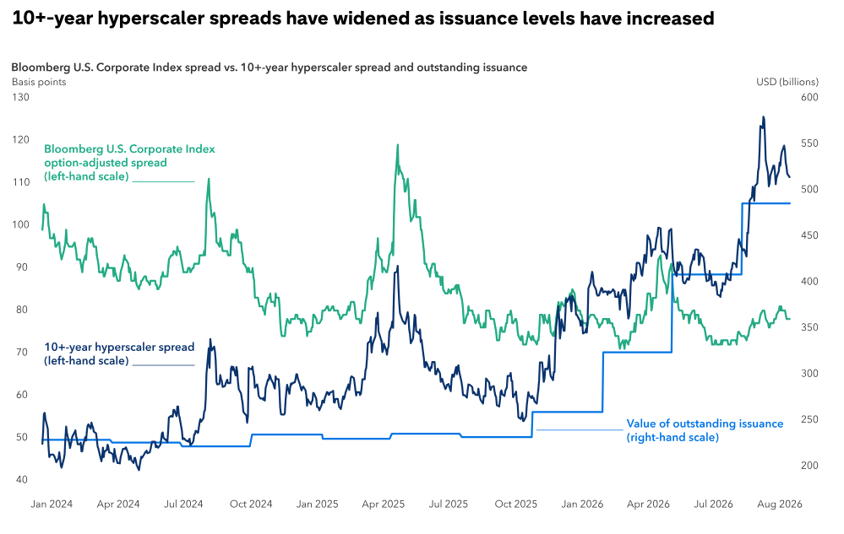
Chart 7: Extra yield on 10-year-plus hyperscaler bonds versus the broad U.S. corporate bond index, alongside the total amount of hyperscaler debt outstanding, January 2024 to August 2026. Source: Capital Group, Sage, Bloomberg.
- Higher spreads. Chart 7 shows the turn. Through 2024 and most of 2025, long-dated hyperscaler bonds paid less extra yield than the average high-quality company, because they were seen as safer. As the amount of their debt outstanding doubled from about $250 billion to nearly $500 billion, that flipped. By August they were paying 115 to 120 bps over Treasuries against 78 bps for the broad index, even though they carry some of the strongest credit ratings in the world. The broad market’s spread did not move at all in 2026; the widening is specific to AI borrowers.
- Bigger discounts on new deals. The median extra yield hyperscalers must offer to get a new bond sold has jumped from about 2 bps last year to 12 bps this year. Of 91 hyperscaler bonds sold in 2026, 78 were trading at higher yields by late July than when they were issued.
- Thinner order books. Apollo tracks how many dollars of orders a bond deal attracts for every dollar sold. For hyperscalers, that ratio fell from nearly 5 to 1 in February to under 2 to 1 by July.
- Debt you don’t see. On top of about $1.35 trillion of bonds on their books, these companies have roughly $1.2 to $1.65 trillion of leases and long-term chip-purchase commitments that sit off the balance sheet.
None of this means the hyperscalers are in trouble. Goldman estimates the four largest could borrow another $1.3 to $1.4 trillion and still keep their top-tier credit ratings. The point is simpler: the bond market has stopped treating AI as a story that pays for itself and started treating it as a flood of supply.
A fair caveat
It would be too neat to say Big Tech is “the” reason rates are high. The U.S. government still issues several times more debt than the hyperscalers, and the familiar drivers (deficits, inflation, weaker foreign demand) still matter most. TwentyFour Asset Management frames it well: hyperscaler borrowing is adding to the pressure on long-term rates rather than being the source of it.
The precise claim is this. At the exact point on the curve where buyers are scarcest and government supply is heaviest, a new borrower has arrived with hundreds of billions of dollars of 30-year paper, no plans to slow down, and a willingness to pay whatever it takes. That is not the whole story of long-term rates. It is the new part of the story, and it does not go away when the Fed cuts.
Why this matters beyond the bond market
None of this is a forecast, and it is not a recommendation to buy or sell anything. It is a description of a change in how the bond market is being supplied, and that change has a few consequences worth understanding.
- Short-term and long-term rates are being driven by different things. The Fed controls the overnight rate. The 30-year rate is set by the balance of long-term savers and long-term borrowers, and that balance now includes five companies issuing hundreds of billions of dollars a year. It is possible for the Fed to cut rates and for long-term yields to stay where they are, or rise, at the same time. That has already happened in several countries this cycle.
- The highest-quality corporate borrowers are paying more than they used to. Companies with AA credit ratings and some of the strongest cash flows in the world now pay about 40 bps more than the average investment-grade company, having paid less than average for most of the last decade. Whether that premium is adequate compensation for the amount of debt still to come is the central debate among bond investors right now.
- The AI story is now visible in bond prices, not just stock prices. For two years the market judged the AI buildout through equity valuations. Spreads, order books and new-issue discounts on hyperscaler bonds now provide a second, independent reading of how investors feel about the spending. The two will not always agree.
- Canadian borrowing costs are connected to this. Canadian five-year fixed mortgage rates track Government of Canada five-year yields, which move closely with U.S. yields. Pressure on the long end of the U.S. curve feeds through to what Canadian households and businesses pay to borrow, regardless of what the Bank of Canada does.
The AI buildout is usually discussed as a technology story or a stock market story. It is also, increasingly, an interest rate story, and that is the part most people have not yet heard.
Sources Used
- Goldman Sachs Global Investment Research, Exhibit 2: Hyperscaler debt issuance across currencies (Dealogic, as of July 9, 2026)
- Yahoo Finance: Big Tech will fund more than a third of its AI investments with debt in 2027, Goldman Sachs predicts (July 28, 2026)
- Reuters via Yahoo Finance: Hyperscaler debt binge pushes yields up as investor demand cools
- Apollo Chief Economist: Cover ratios for hyperscaler bonds declining (July 15, 2026)
- Apollo Academy: Growing IG issuance will put upward pressure on rates and credit spreads
- TwentyFour Asset Management: How hyperscaler issuance is reshaping the Treasury curve
- UBS CIO: Hyperscaler debt issuance in the spotlight (September 9, 2026)
- Futu News: Goldman Sachs raises 2027 hyperscaler issuance forecast to $420 billion (September 2026)
- Fortune: After a nearly 1,000% surge, the AI debt orgy can’t last forever (July 31, 2026)
- NAI500: AI hyperscalers turn to debt as bond spreads widen (September 2026)
- MLQ.ai: Hyperscaler bond issuance reaches about $220 billion as AI financing costs rise (August 2026)
- Capital Group: The AI debt boom, balancing risk and opportunity (September 23, 2026)
- Investing.com: Microsoft only US hyperscaler with positive free cash flow as AI capex bites (August 2026)
- CNBC: Hyperscalers face higher capex scrutiny after Alphabet report panned (July 28, 2026)
- FactSet Insight: Hyperscalers tap external financing as AI capex outruns cash flow
- U.S. Treasury Daily Par Yield Curve Rates via YourBestSavings (October 8, 2026)
- FRED: 30-Year Treasury Constant Maturity (DGS30)
- CNBC: 10-year Treasury yield rockets to 19-year high (September 23, 2026)
- CNBC: 30-year Treasury yield hits highest level since 2004 (September 24, 2026)
- CNBC: 30-year Treasury bond yield scales to highest level since 2002 (September 29, 2026)
- CNBC: 10-year Treasury yield ticks higher despite weaker-than-expected jobs report (October 2, 2026)
- CNBC: Treasury yields rebound after Bessent buyback intervention (August 20, 2026)
- Axios: Treasury yields rip higher on renewed inflation fear (September 24, 2026)
- Advisor Perspectives: Treasury Yields Snapshot, August 28, 2026